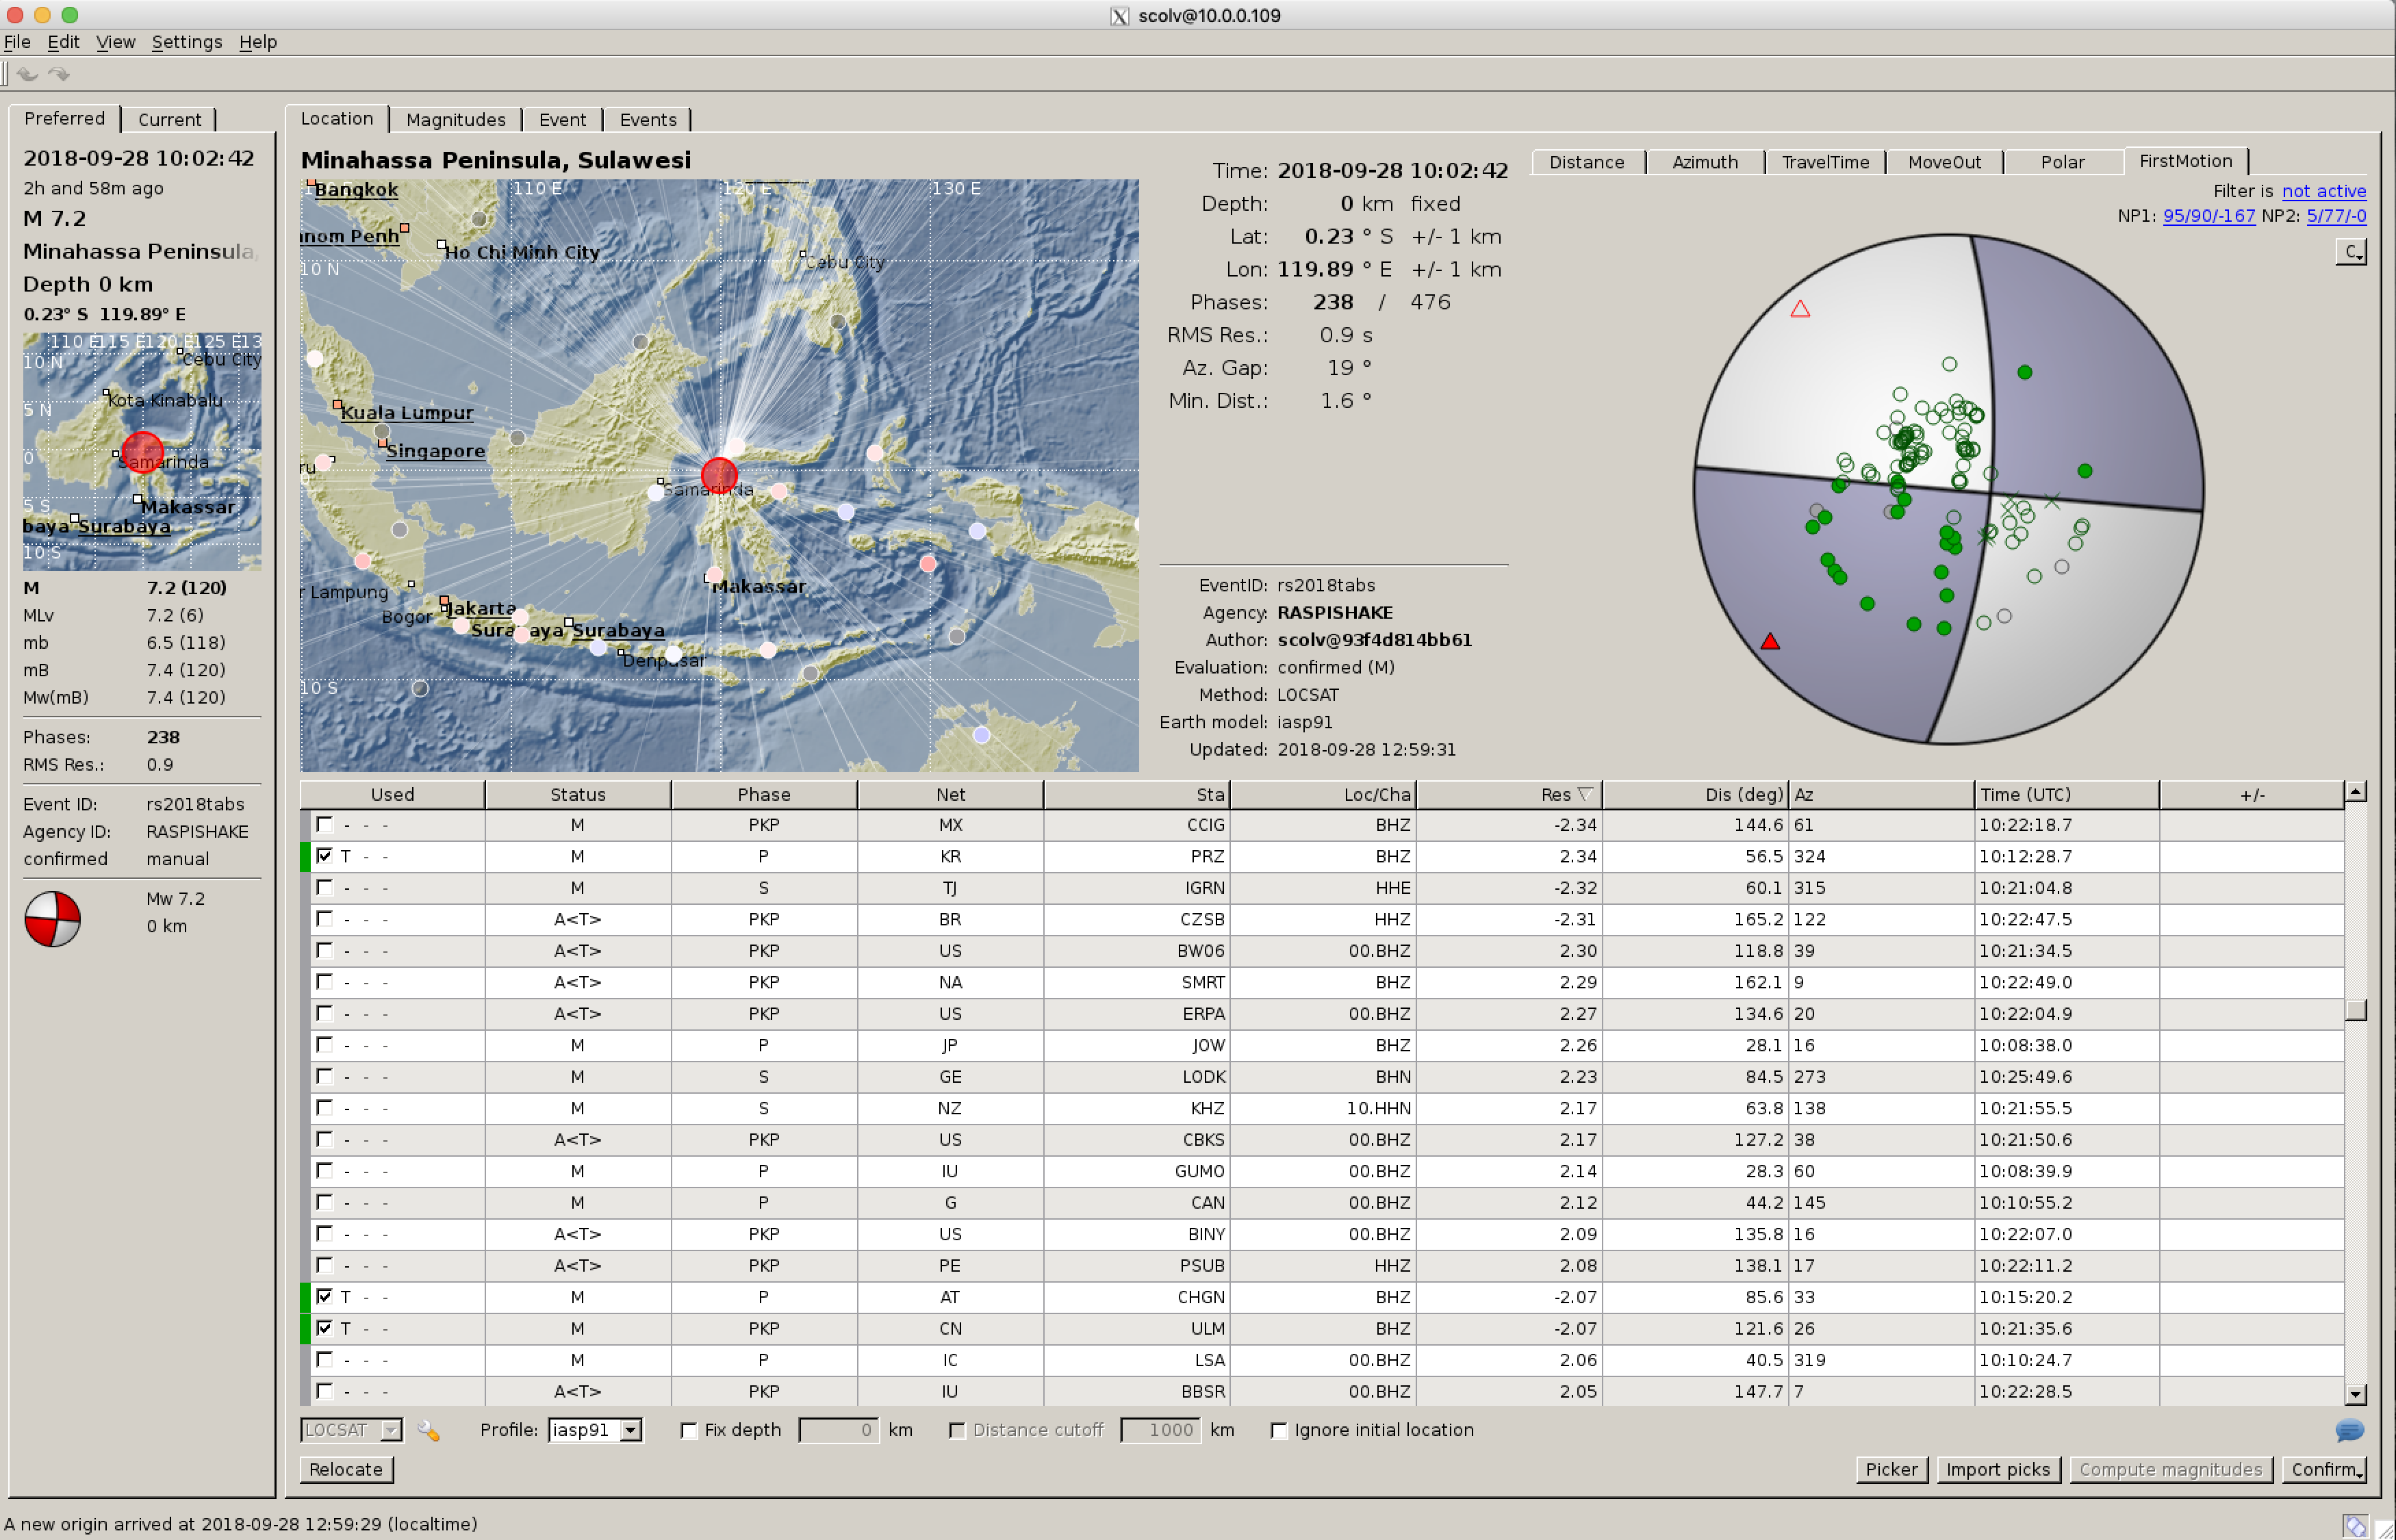
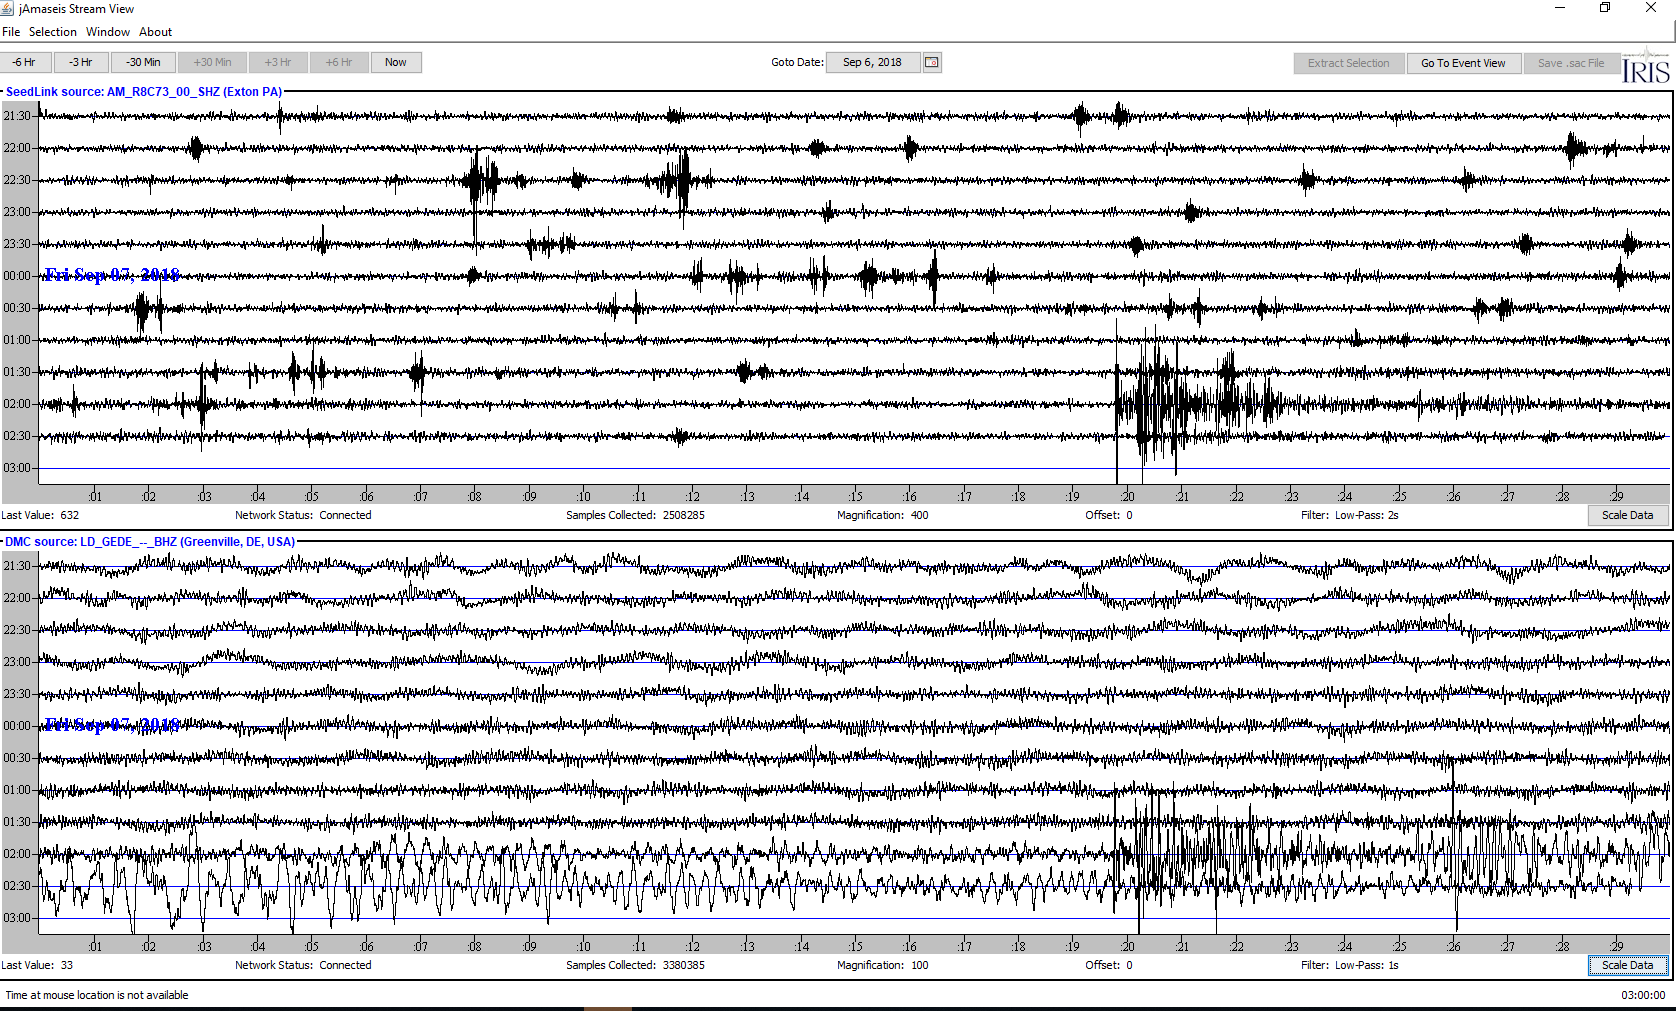
Indonesia – M7.5 – Sept 28, 2018 at 10:02:43 UTC

Position: 0.178°S   119.840°E – Depth: 10 km
This earthquake killed thousands on the island of Sulawesi and generated a 3 to 5 meter high tsunami.

USGS Information Page

IRIS Information Page

New York Times article

NY Times Video of the tsunami and earthquake

Tectonic Summary

From the USGS Information Page

The September 28, 2018, M 7.5 earthquake near Sulawesi, Indonesia occurred as a result of strike-slip faulting at shallow depths within the interior of the Molucca Sea microplate, part of the broader Sunda tectonic plate. Focal mechanism solutions for the earthquake indicate rupture occurred on either a left-lateral north-south striking fault, or along a right-lateral east-west striking fault. Eastern Indonesia is characterized by complex tectonics in which motions of numerous small microplates are accommodating large-scale convergence between the Australia, Sunda, Pacific, and Philippine Sea plates. At the location of the September 28th earthquake, the Sunda plate moves south with respect to Molucca Sea plate at a velocity of about 30 mm/year.

While commonly plotted as points on maps, earthquakes of this size are more appropriately described as slip over a larger fault area. Strike-slip events of the size of the September 28, 2018 earthquake are typically about 120×20 km in size (length x width); modeling of this earthquake implies dimensions of ~80×30 km, predominantly down-dip and south of the hypocenter.

Shallow earthquakes of this size can often have a deadly impact on nearby communities. Historically, this region has hosted several large earthquakes, with fifteen events of M 6.5 and larger within 250 km of the September 28th earthquake over the preceding century. The largest of these was a M 7.9 earthquake in January 1996, about 100 km to the north of the September 28, 2018 event. The 1996 earthquake – a shallow thrust faulting earthquake likely to have occurred on the regional subduction zone system at depth beneath the shallow crust – resulted in approximately 10 fatalities, over 60 injuries, and significant building damage in the local region. The September 28, 2018 earthquake was preceded by a series of small-to-moderate sized earthquakes over the hours leading up to this event; the USGS located 4 other earthquakes of M 4.9 and larger in the epicentral region, beginning with a M 6.1 earthquake three hours earlier and just to the south of the M 7.5 event. There has also been an active aftershock sequence, with ten events of M 4.7 and larger in the three hours following this earthquake. The largest aftershock in this timeframe was M 5.8, about 12 minutes after the M 7.5 earthquake.

Jamaseis heliocoder trace of AM.RC8C73.00.SHZ (Exton PA) and LD.WUPA.BHZ (West Chester PA). The P wave arrivals are annotated. Note the strong surface waves captured by WUPA’s broadband sensor.

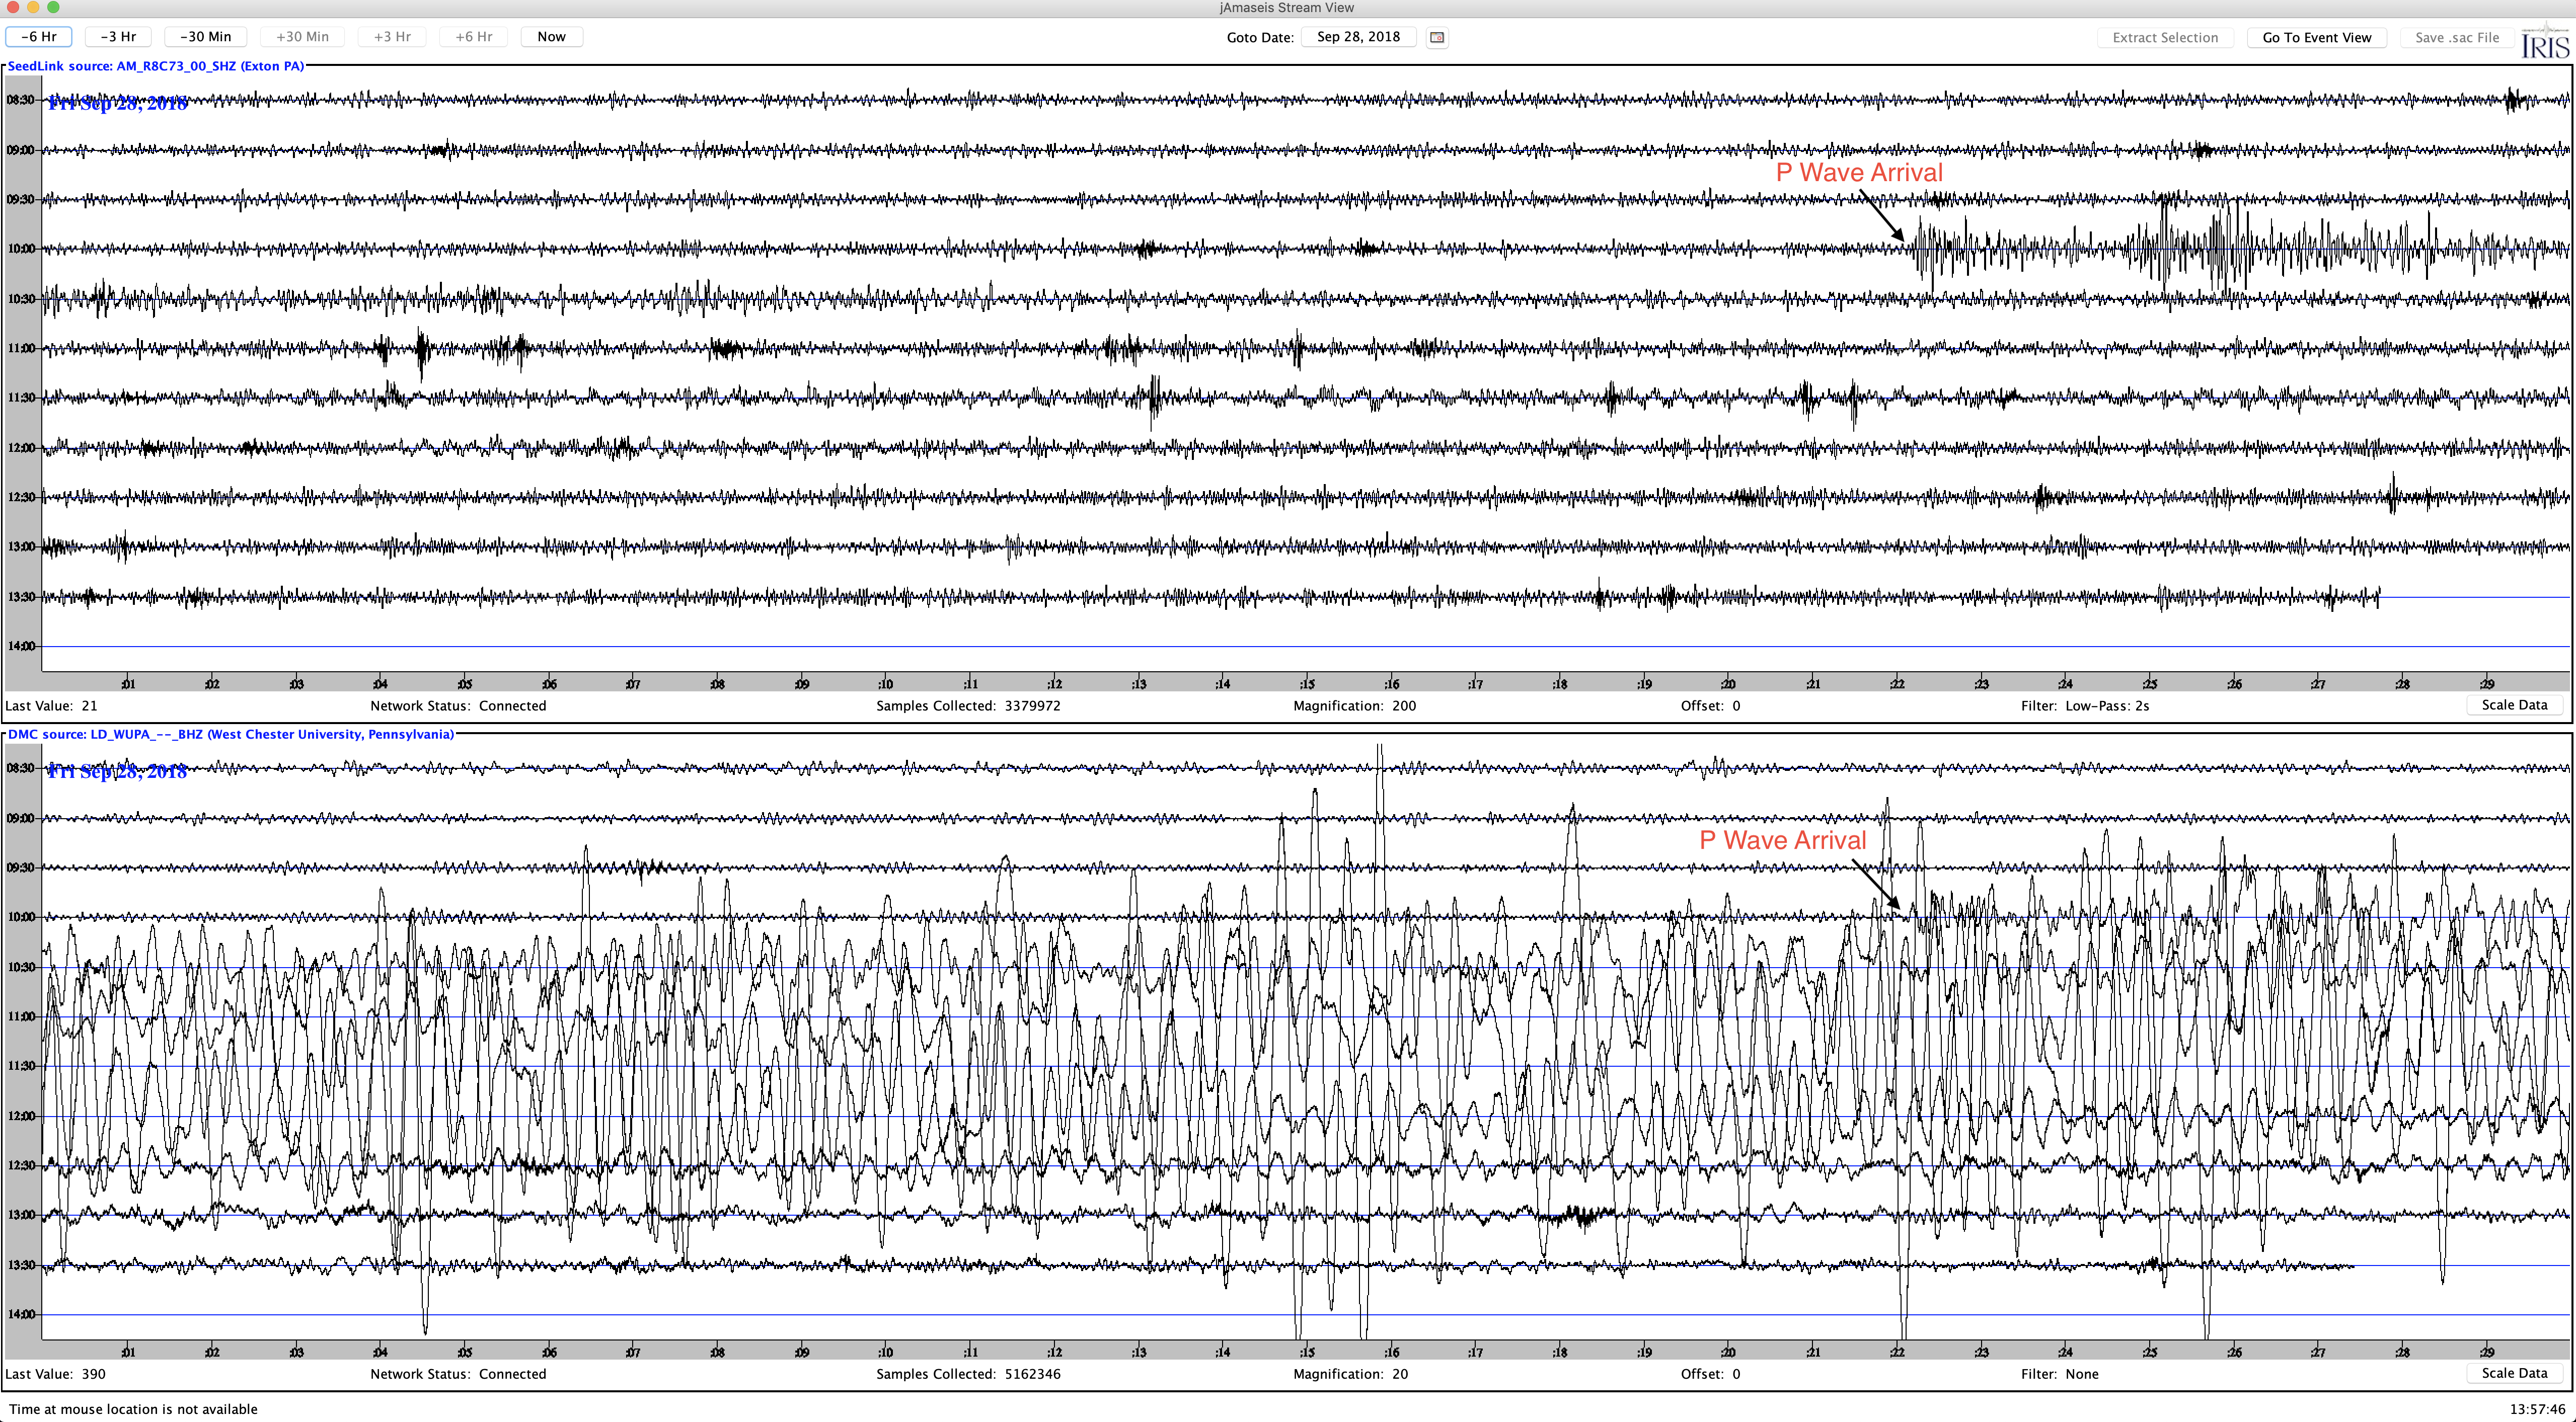
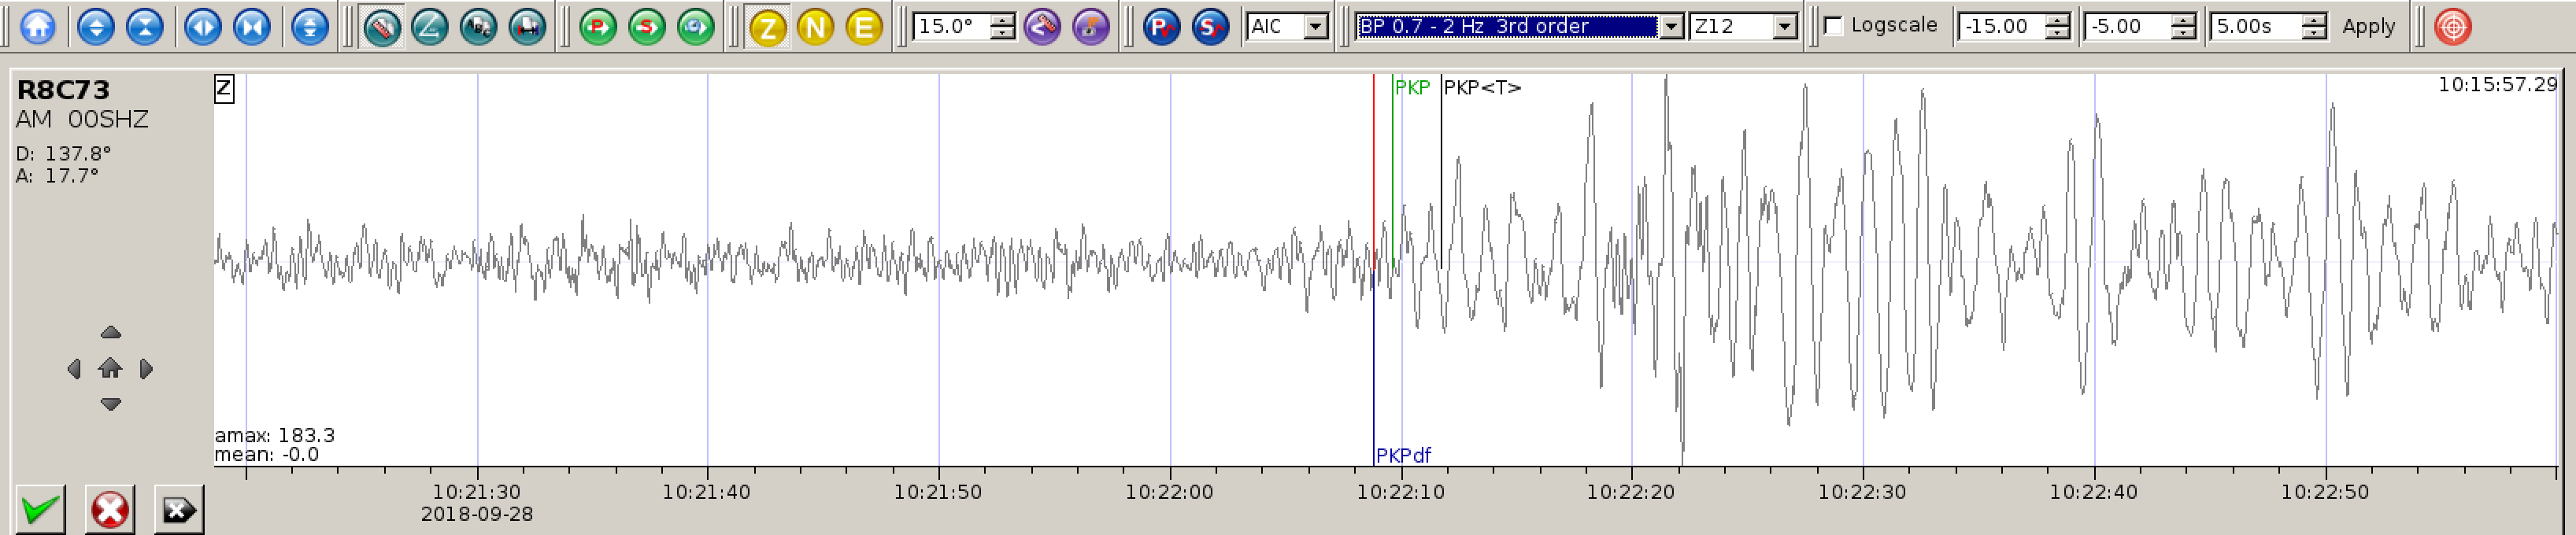
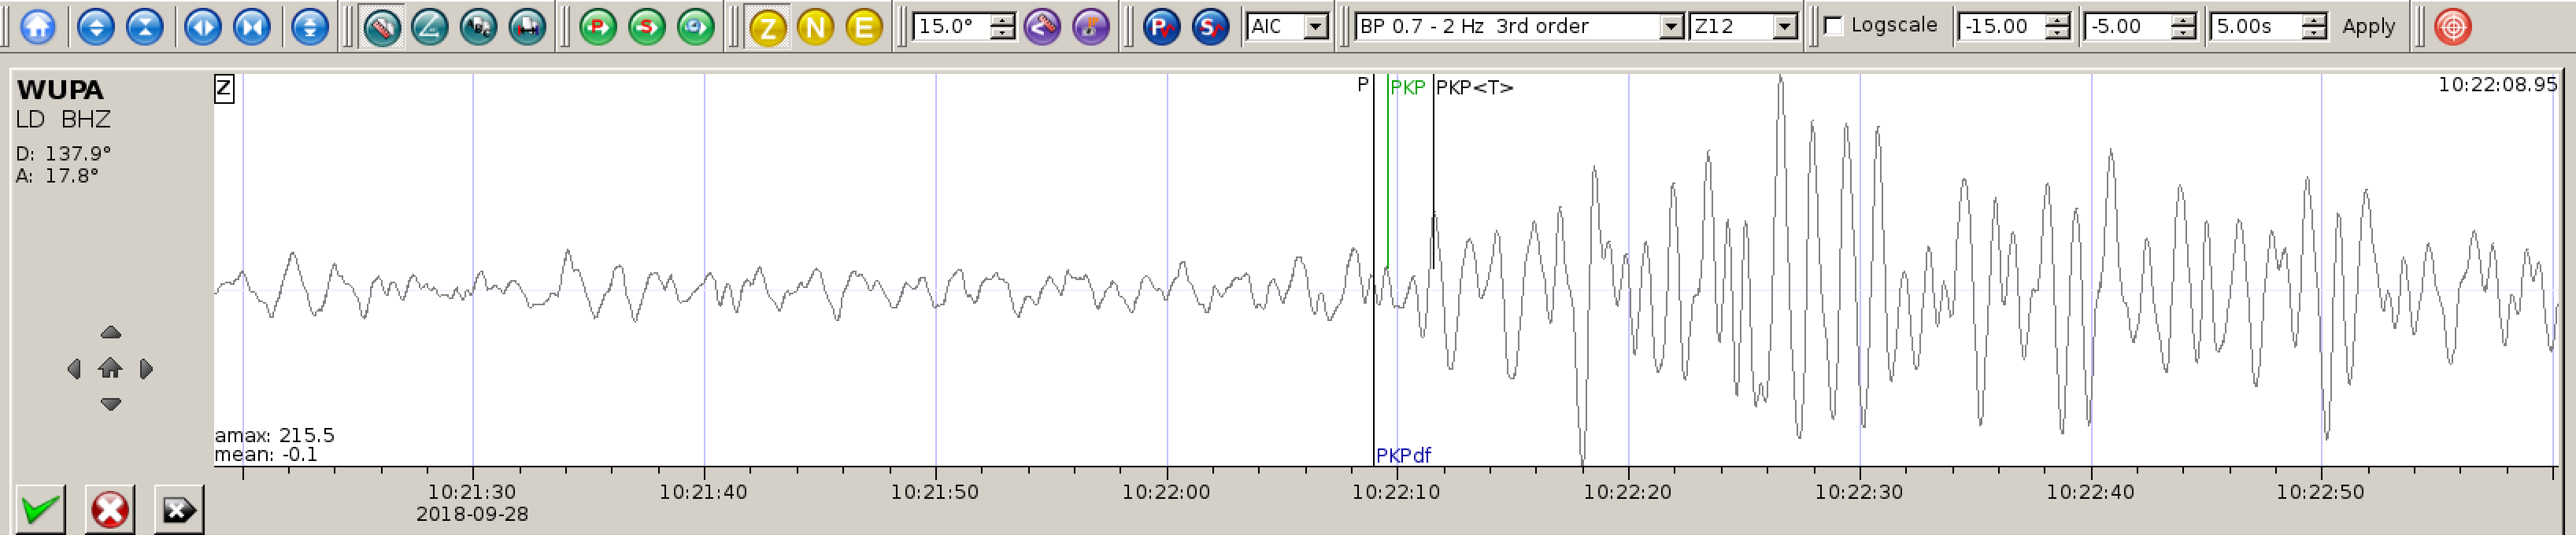
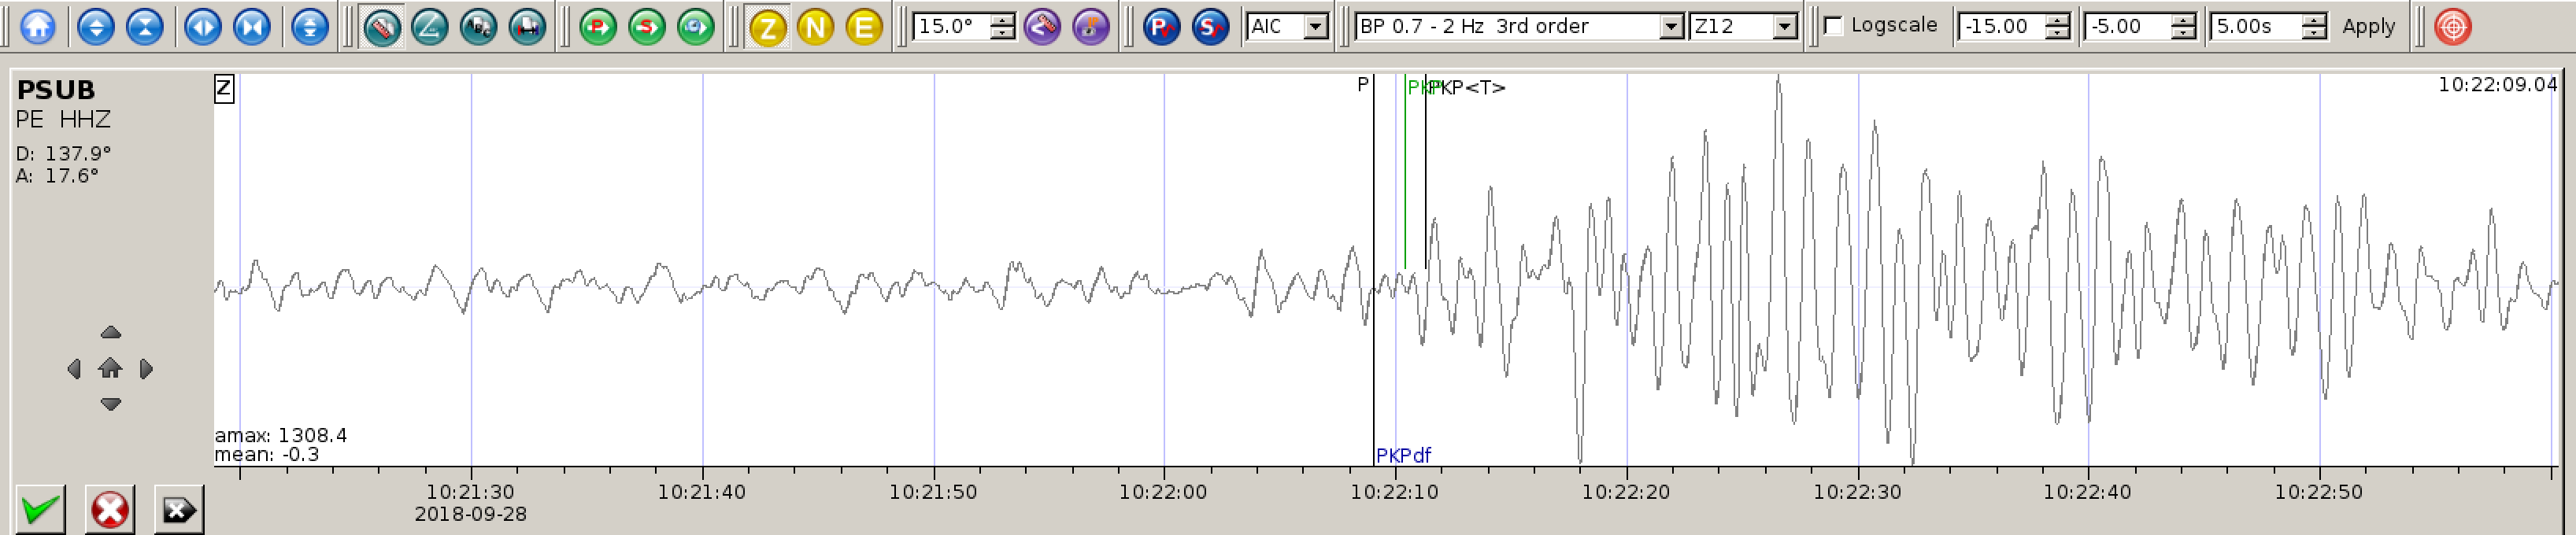
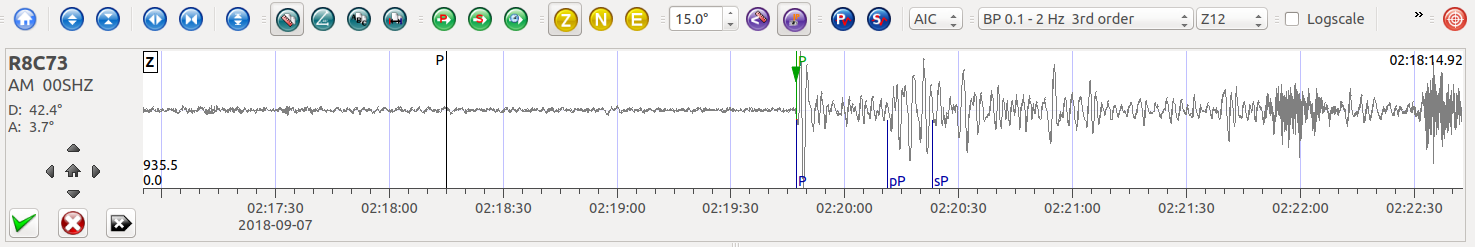
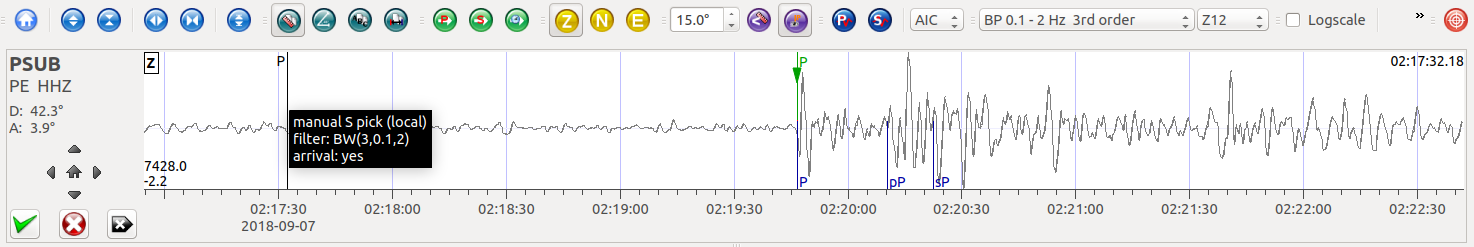
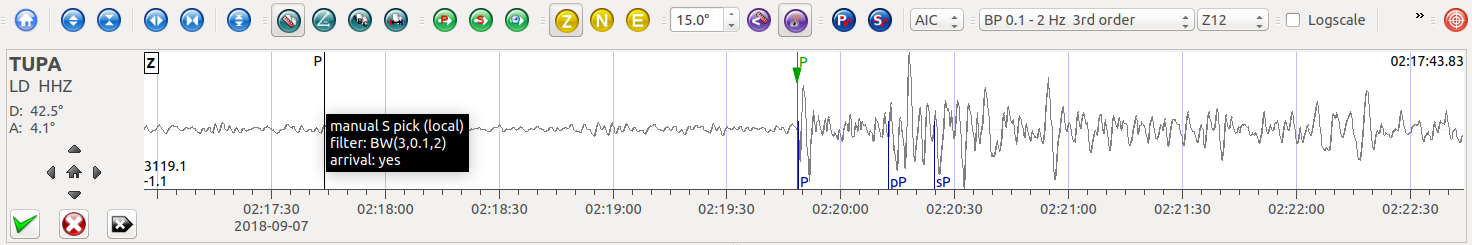
Distance: 137.9 Deg. 15,324km
Azimuth: 17.57 Deg.

SeisComP3 traces for AM.R8C73.00.SHZ (Exton PA), LD.WUPA.BHZ (West Chester University, West Chester PA), and PE.PSUB.HHZ (Media PA) showing the P wave arrivals.
SeisComP3 display showing the focal mechanism for this event.
SeisComP3 Map View (scmv) of seismometers about 2 hours after the main shock showing a high level of ground motion (yellow, orange, and red triangles), particularly in North America. This is due to high amplitude surface waves as well as continuing aftershocks.

New Caledonia – M6.3 – Sept 10, 2018 at 19:31:37 UTC

Position:22.027°S   170.129°E – Depth: 12 km

The top trace is for G.DZM.00.BHZ on New Caledonia showing the quake from a point near the epicenter. The bottom two traces are for AM.R8C73.00.SHZ (Exton PA), and LD.GEDE.BHZ (Greenville DE).

Jamaseis trace for AM.R8C73.00.SHZ (Exton PA) and LD.GEDE.BHZ (Greenville DE). The P wave arrivals are not easily seen on either trace. However prominent surface waves can be seen for LD.GEDE.BHZ.

Distance: 122.4 deg, 13,587 km

Azimuth: 55.7 deg

L’Esperance Rock – New Zealand – M6.9 – Sept 10, 2018 at 04:19:02 UTC

Position:31.842°S   179.334°W – Depth: 111.1 km

SeisComP3 traces for AM.R8C73.00.SHZ (Exton PA) and LD.GEDE.BHZ (Greenville DE) showing the P wave arrivals. The signals are both extremely weak despite the magnitude of this event. This is due to both stations being in the middle of the shadow zone (at 119 deg).

Distance: 119.7 deg, 13,289 km

Azimuth: 58.9 deg

SeisComP3 focal mechanism plot for this earthquake.

Solomon Islands – M6.5 – Sept 9, 2018 at 19:31:34 UTC

Position: 10.008°S   161.533°E – Depth: 64.5 km

Jamaseis heliocoder trace of AM.R8C73.00.SHZ and PE.PSUB.HHZ. The P wave arrivals are annotated. At this distance direct S waves are not present as they cannot pass through the liquid outer core. As a result there isn’t much to see on R8C73 as it is mostly sensitive to the higher frequency body waves (P and S). On PSUB however you can see long period surface waves starting at about 20:02. These continue for another 90 minutes.
Distance: 145.9 Deg. 16,230km
Azimuth: 27.4 Deg.
SeisComP3 traces for AM.R8C73.00.SHZ (Exton PA), PE.PSUB.HHZ (Media PA,) and LD.GEDE.BHZ (Greenville DE) showing the P wave arrivals.

Distance: 121.6 Deg, 13,504 km

Azimuth: 48.9 Deg

Pennsylvania – M2.9 – Sept 7, 2018 at 18:07:39 UTC

Position: 41.49 deg N, 77.36 W – Depth: 0 km
Normally such a small earthquake wouldn’t turn up here, but it is semi-local and these small quakes don’t always show up in the USGS listings (this one didn’t).

SeisComP3 display showing the station that recorded this event.
SeisComP3 traces for PE.PALR.HHZ (Geleton PA, the closest seismometer to the quake), AM.R8C73.00.SHZ (Exton PA) and LD.WUPA.BHZ (West Chester University, West Chester PA).

Distance (to Exton PA): 2.0 deg, 220 km

Arimuth: 137.4 deg

Ecuador – M6.2 – Sept 7, 2018 at 02:12.04 UTC

Position:2.345°S   78.896°W – Depth: 93.5 km

Jamaseis heliocoder trace of AM.RC8C73.00.SHZ (Exton PA) and LD.GEDE.BHZ (Greenville DE). The wavy trace on LD.GEDE.BHZ is due to surface waves from the Fiji earthquake earlier in the day.

Distance: 42.4 Deg. 4,703 km
Azimuth: 3.7 Deg.

SeisComP3 traces for AM.R8C73.00.SHZ (Exton PA), PE.PSUB.HHZ (Media PA), and LD.TUPA.HHZ (Ambler PA) showing the P wave arrivals.